Experimental aerodynamics / 2024 to present
VortexField
Apparatus.
A modular, 32-fan programmable open-jet wind wall for controlled axial-inflow generation and propeller-interaction research.
System overview
Not a wind tunnel.
A programmable
inflow source.
The VFa generates exploratory, spatially nonuniform axial inflow, not a perfectly uniform freestream.
01 / Project brief
32 fans.
One flowfield.
Many commands.
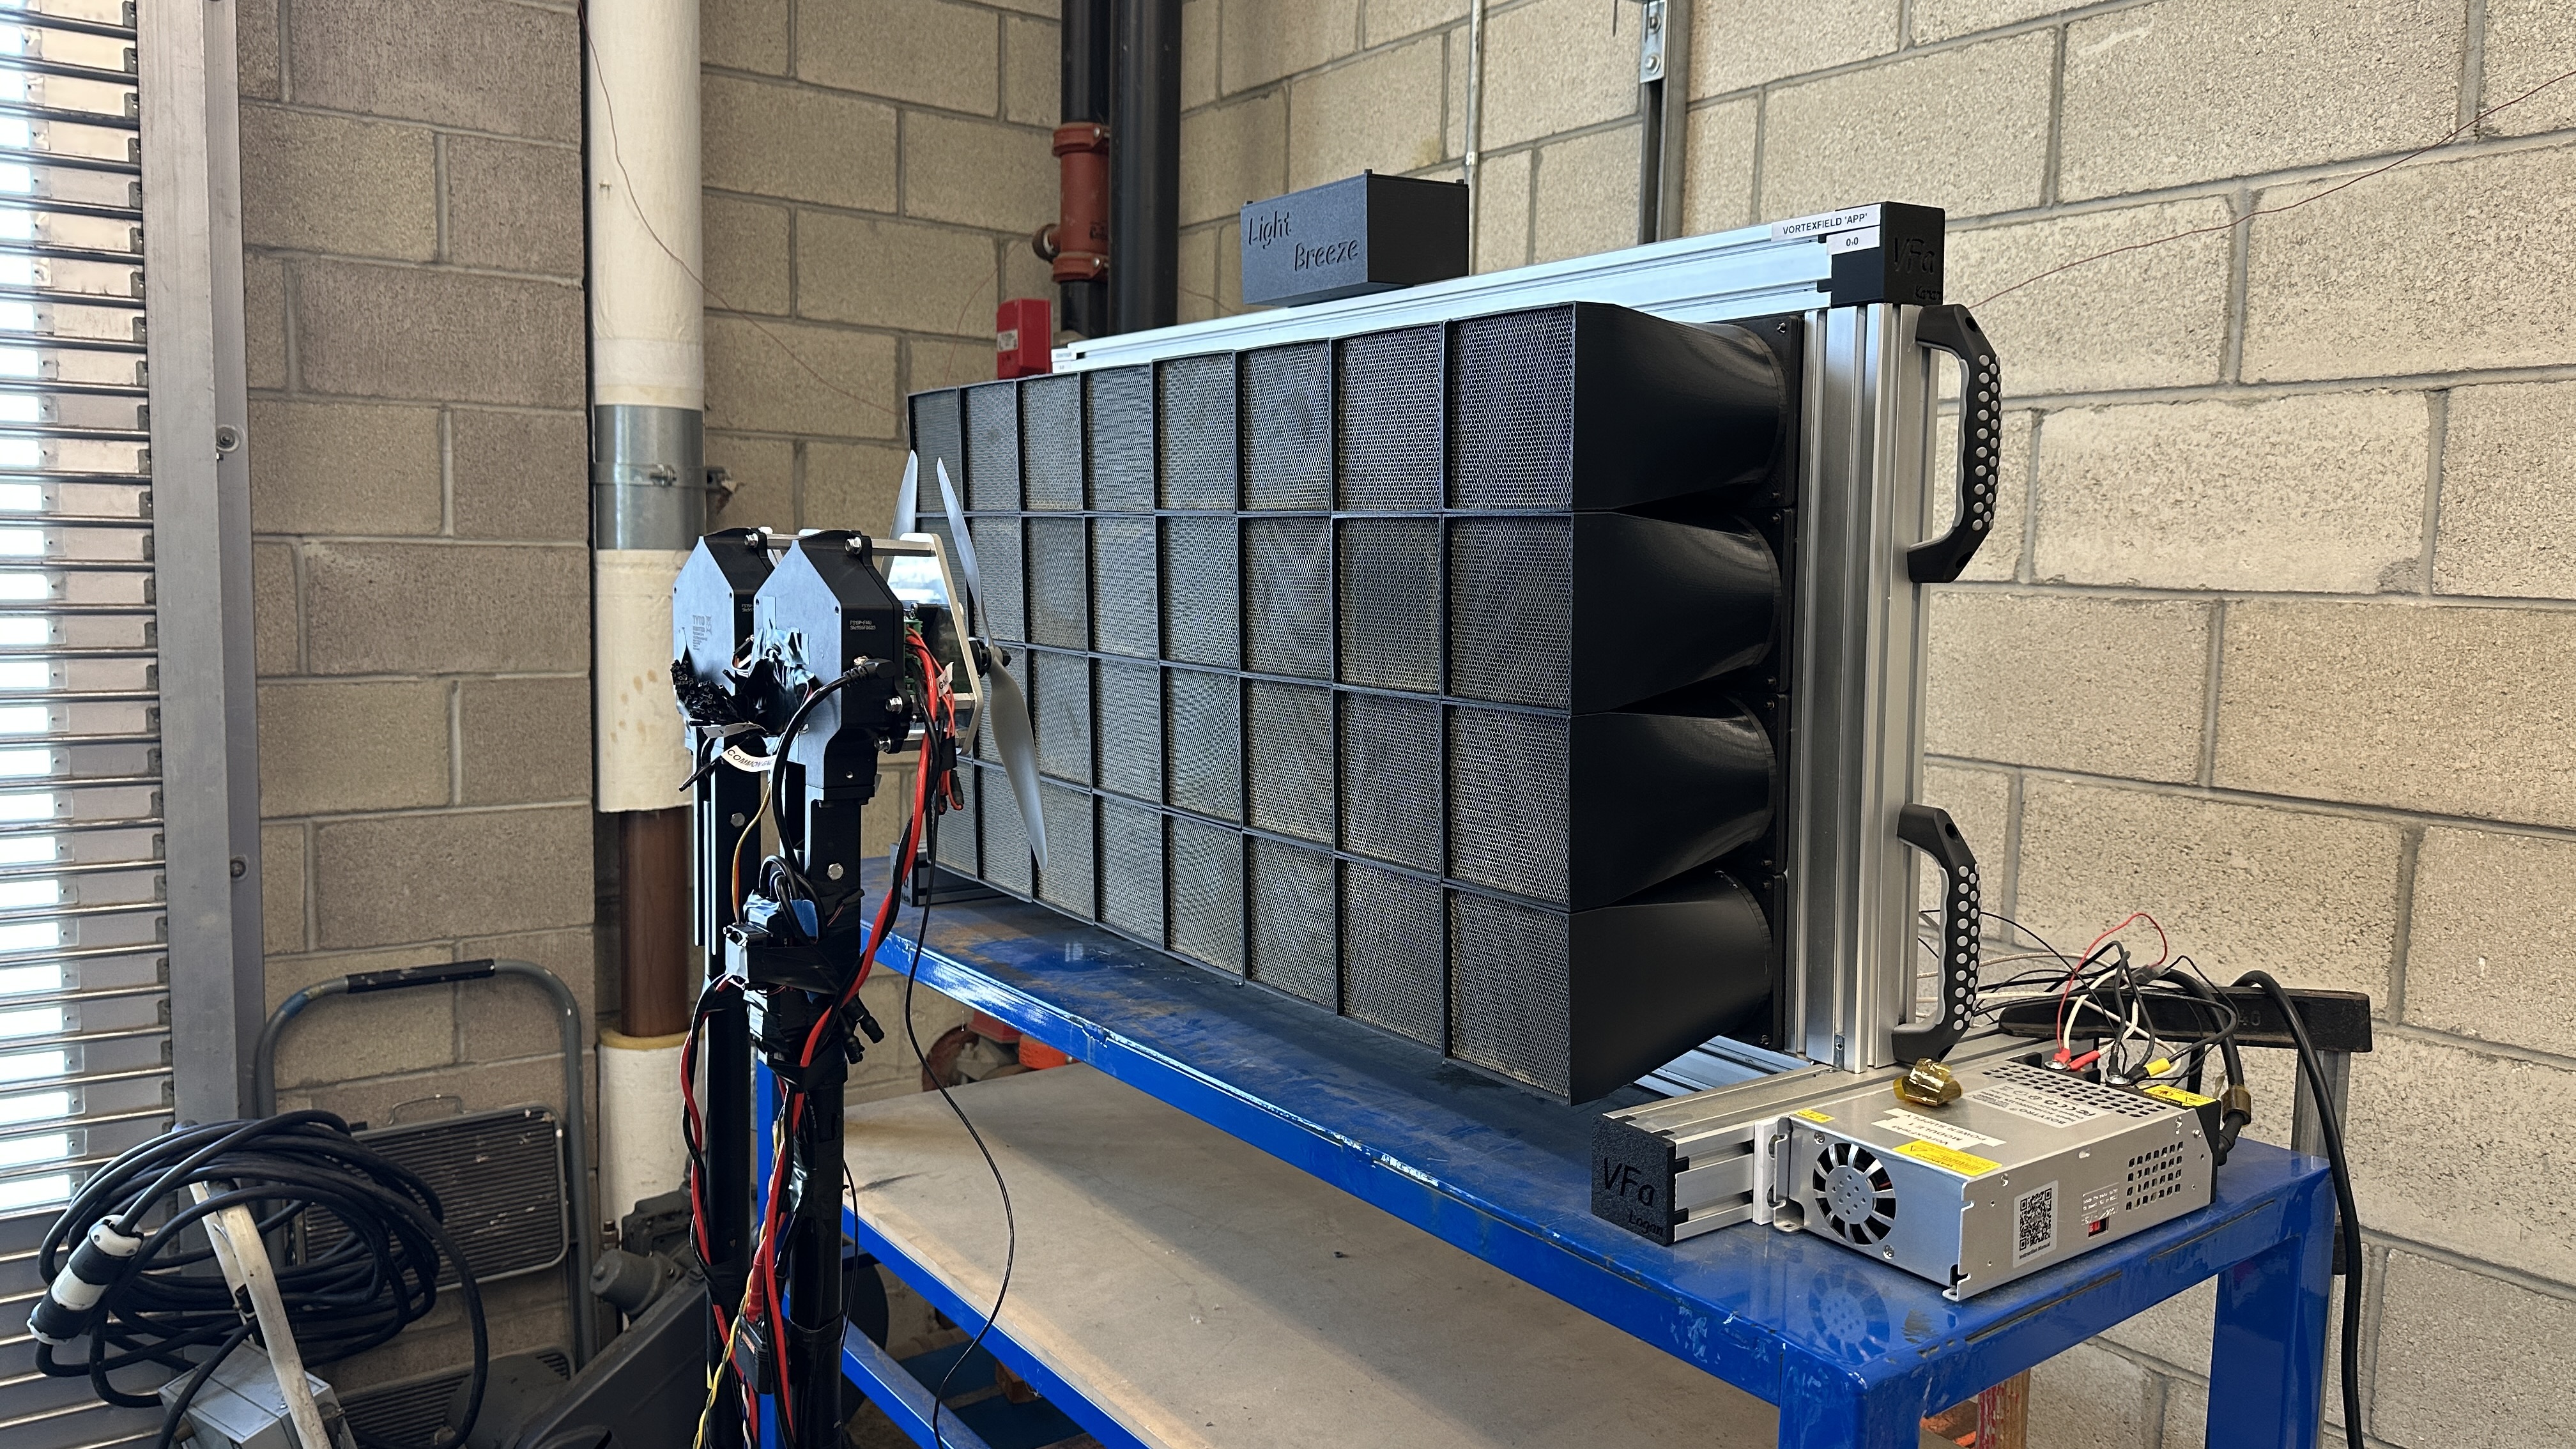
The VFa is an 8 × 4 array built from two 4 × 4 modules of Delta PFC1212DE fans. Every fan is separately PWM-controlled, allowing spatially varying commands rather than a single all-or-nothing flow setting.
Two ESP32 DevKits each control 16 fans. A custom Python GUI sends a 1 × 32 PWM command vector, split between the controllers. At full duty cycle, the 960 × 480 mm array draws roughly 1.84 kW through two dedicated ~1 kW supplies with inline fusing.
02 / Control architecture
A command for
every fan.
The control framework supports all-fans-equal operation, independently commanded fan duty cycles, and spatially varying flow commands. It has also been expanded conservatively toward time-varying flowfield generation.
03 / Flow conditioning
Turning fan wakes
into usable inflow.
Raw fan outlets brought swirl, radial components, gaps, and pronounced hub deficits.
I designed circular-to-square diffuser shrouds with a 3° half-angle and selected 1-inch aluminum honeycomb through pressure-loss comparisons. The shrouds transition each ~116 mm circular outlet to a tileable square exit, while the honeycomb improves downstream alignment at the cost of mean velocity.
Improve alignment.
Preserve modularity.
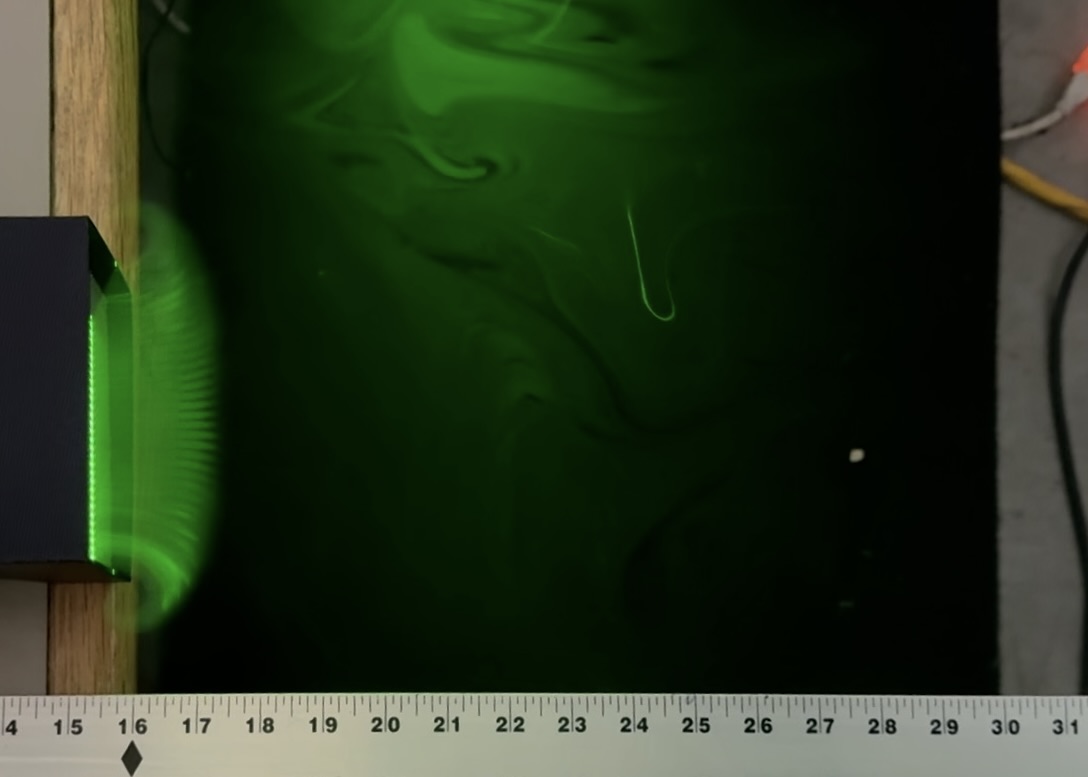
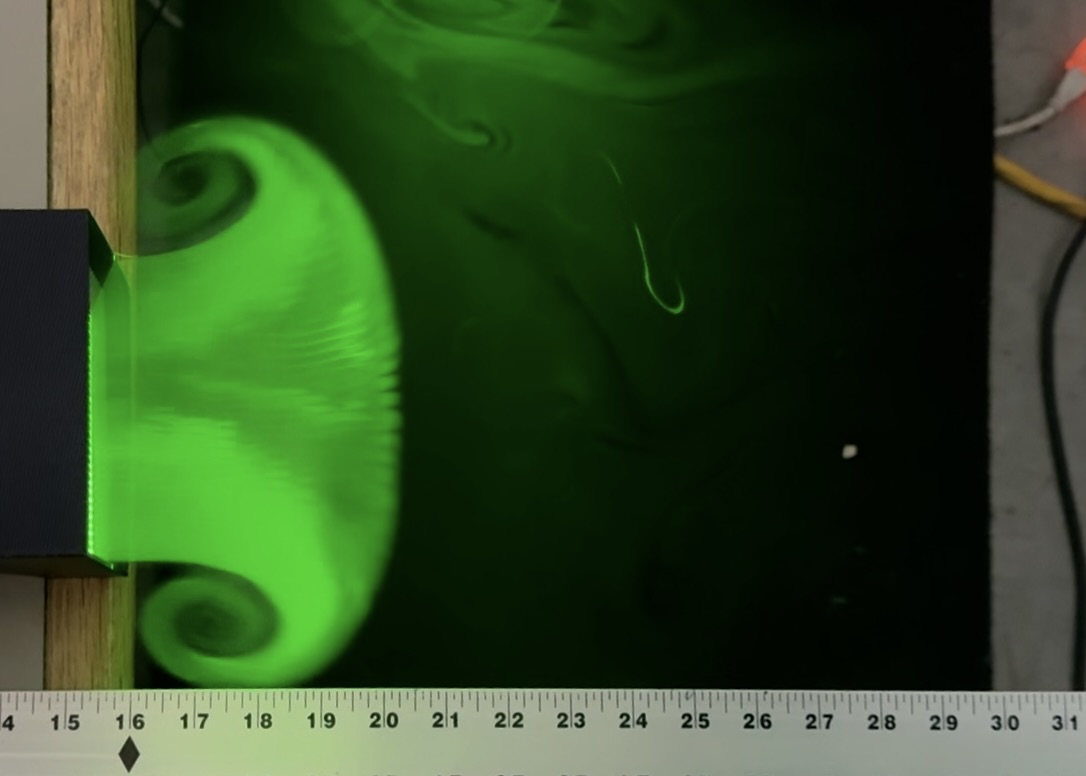
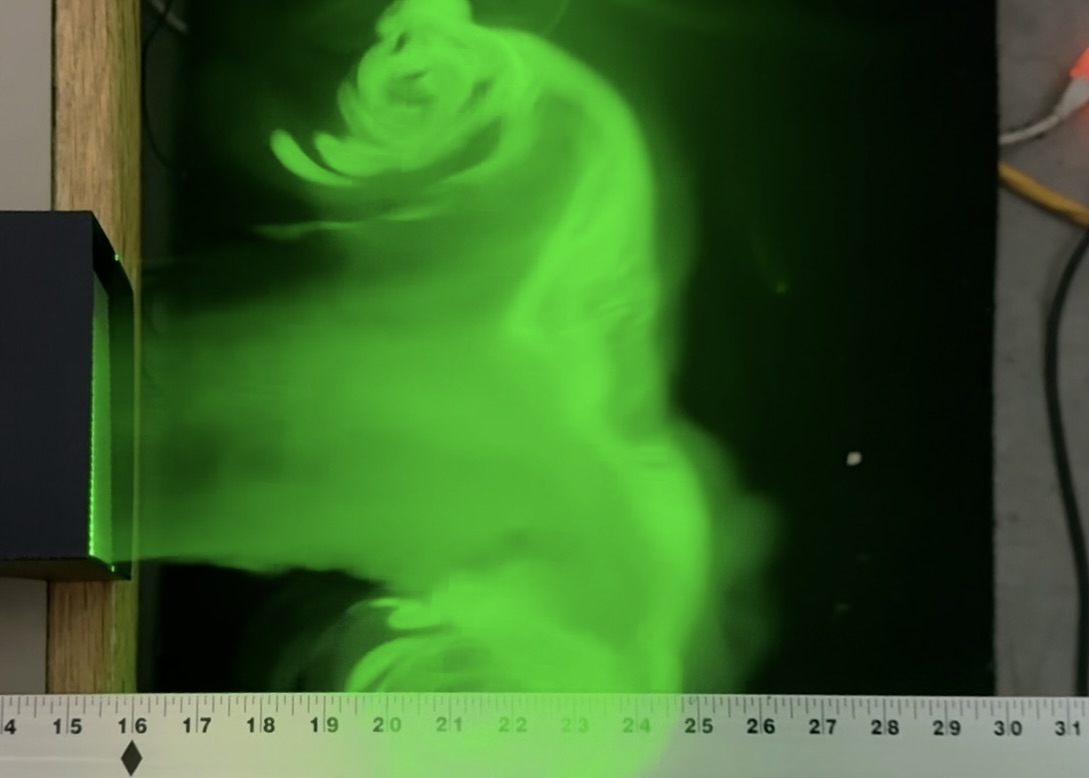
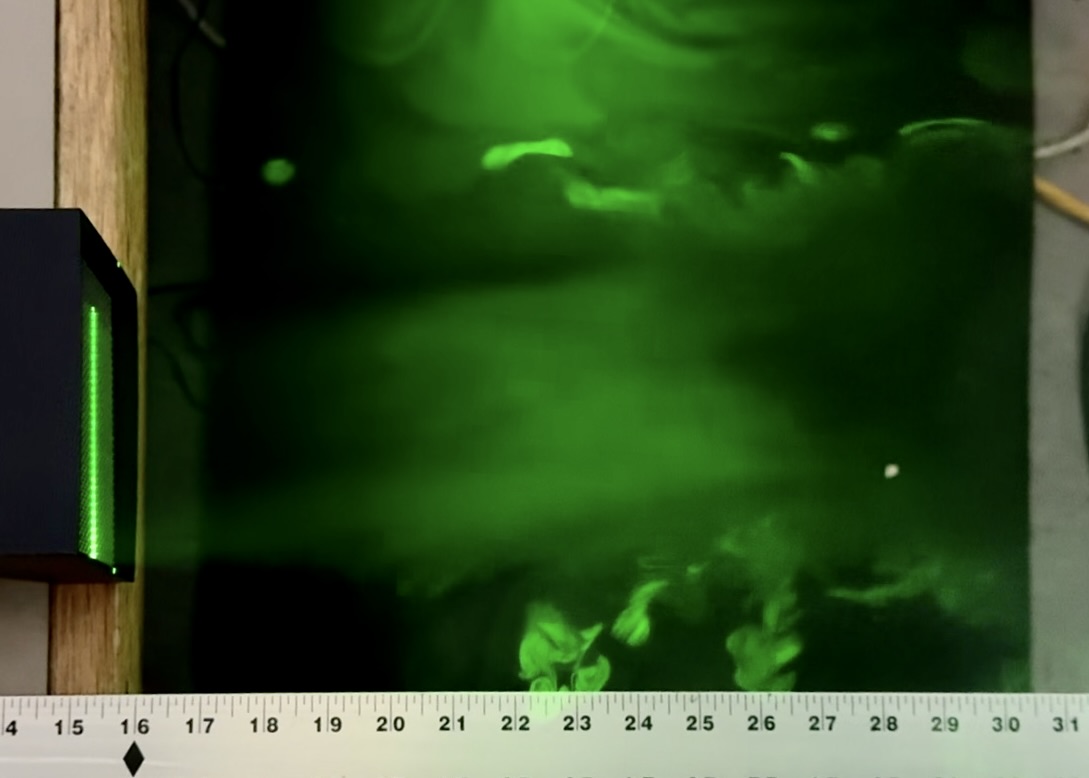
Flow visualization using a fog machine and green laser sheet confirmed reduced visible swirl and a more square outlet flow shape downstream of the conditioning hardware.
04 / Individual fan calibration
Same command.
Different fan.
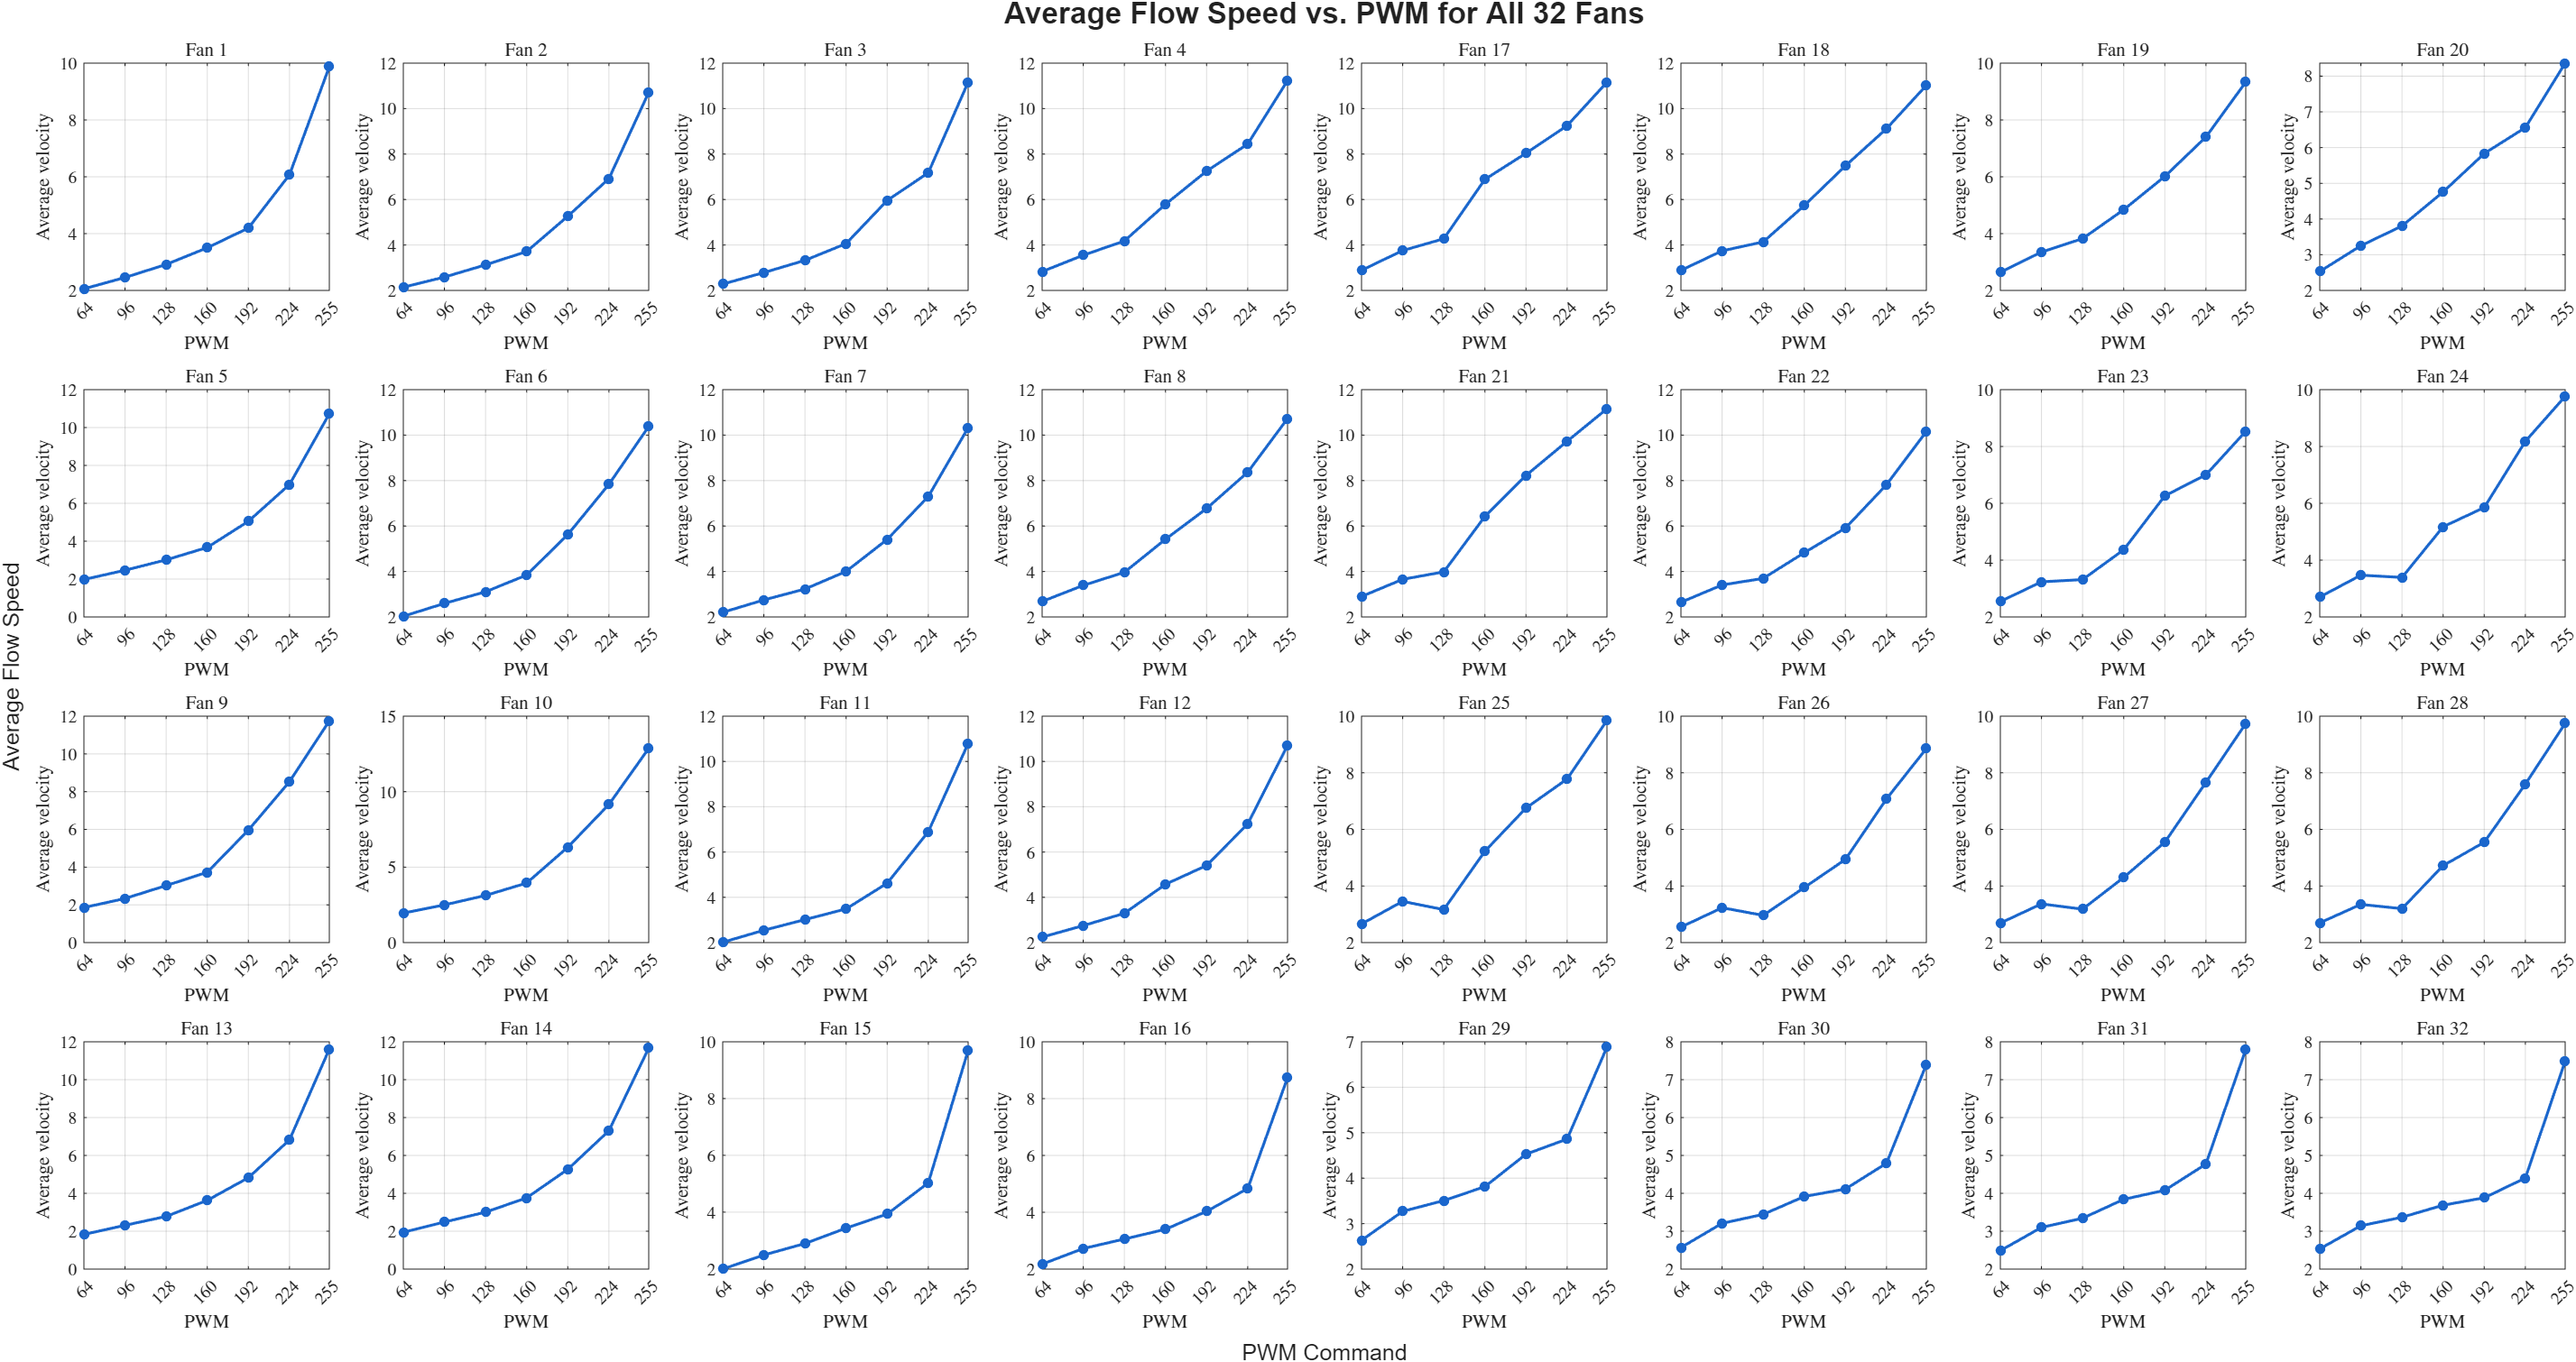
Nominally identical fans did not deliver identical velocity for the same PWM command.
I consolidated the complete calibration dataset and generated fan-specific PWM-to-velocity relationships for all 32 fans. Calibration covered seven PWM levels and a 5 × 5 grid across each fan outlet. I collected several datasets; Nathan Guerra collected additional sets.
05 / Flowfield validation
Calibration improved
commands, not physics.
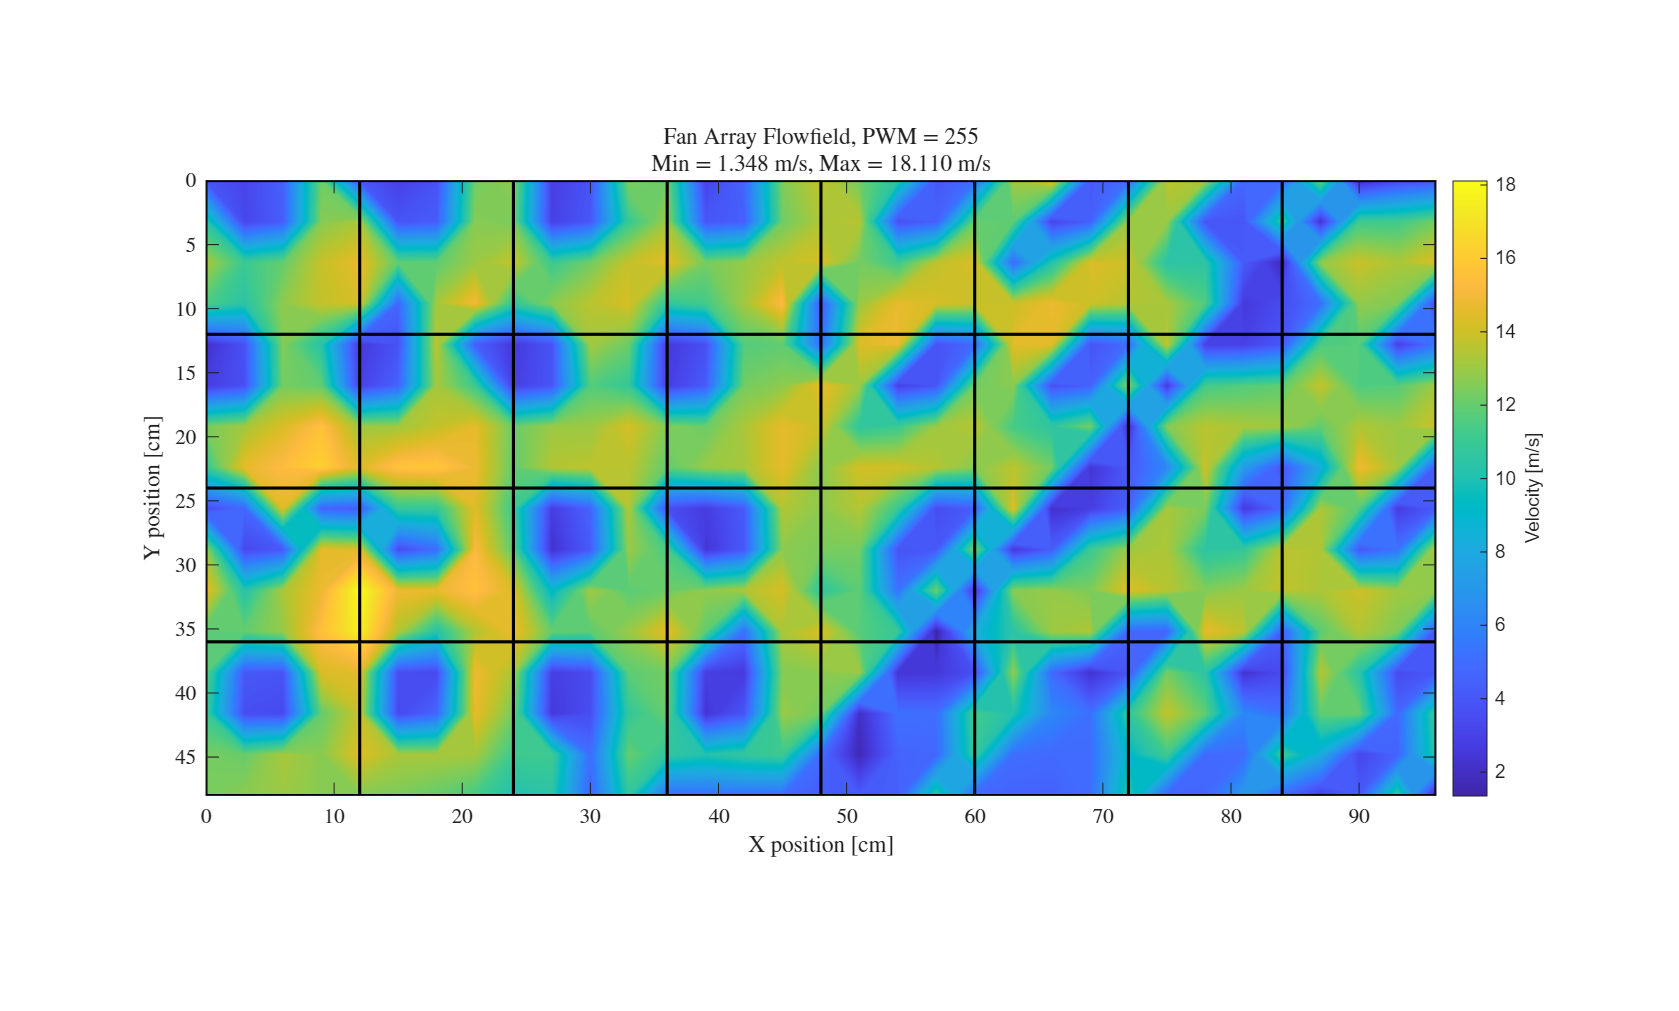
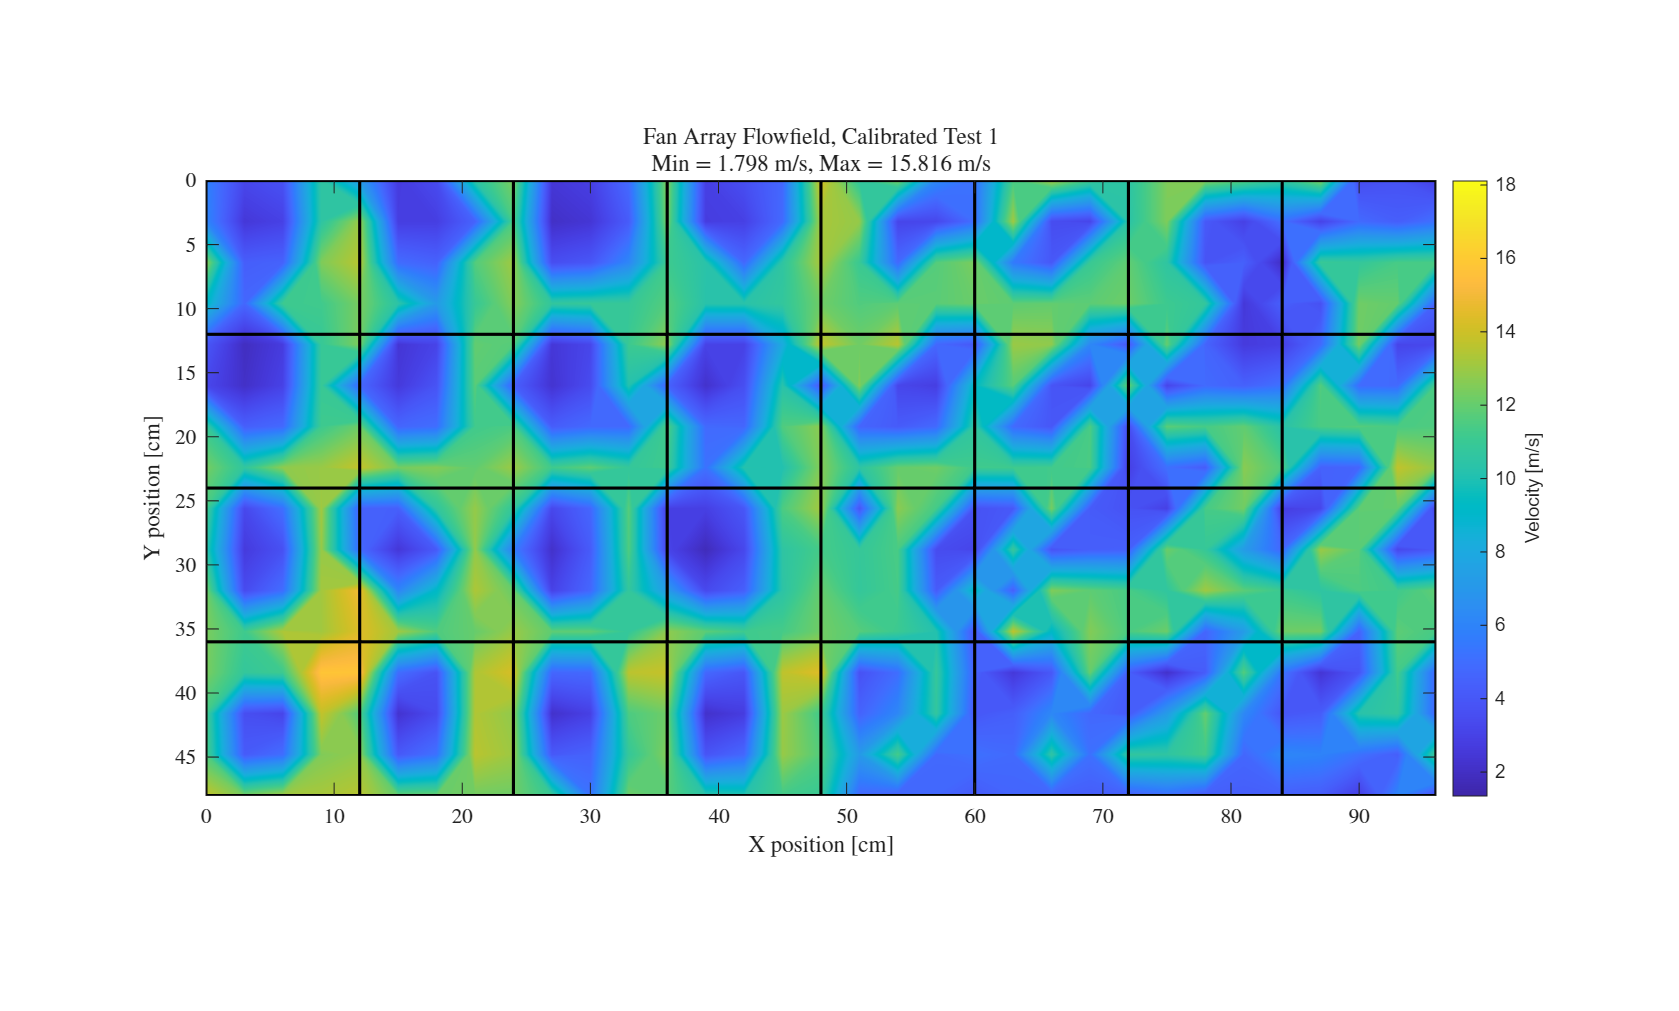
Fan-specific commands improved consistency, while substantial spatial variation remained.
I used hot-wire anemometry and MATLAB post-processing to map the array flowfield. Fan-hub deficits, fan-to-fan interaction, residual flow structures, and measurement-plane effects remain central limitations. Calibration does not make the VFa a uniform wind tunnel.
06 / Flow visualization
Seeing the flow
as it develops.
Green laser-sheet visualization provided a direct qualitative view of the conditioned outlet flow and downstream structures.
07 / Propeller benchmark
Test the source
against a reference.
I benchmarked an APC 12 × 4.5 MR propeller on the Cal Poly Flight Test Stand against the Cal Poly Low Speed Wind Tunnel.
The comparison covered 800 to 2400 RPM and measured thrust and torque, post-processed into Ct, Cq, and advance ratio. Differences between the VFa and wind-tunnel results were expected and tied to inflow-speed mismatch, local velocity variation, array nonuniformity, and alignment, not treated as evidence of equivalence.
08 / Publication
Research worth
sharing.
The original VFa design and validation work was published for the 2026 AIAA Regional Student Conferences.
Kanan Thummar and Nandeesh Hiremath, “Design and Validation of a Multi-Fan Modular Open-Jet Wind Wall for Controlled Inflow Generation,” 2026 AIAA Regional Student Conferences.
Read the publication ↗